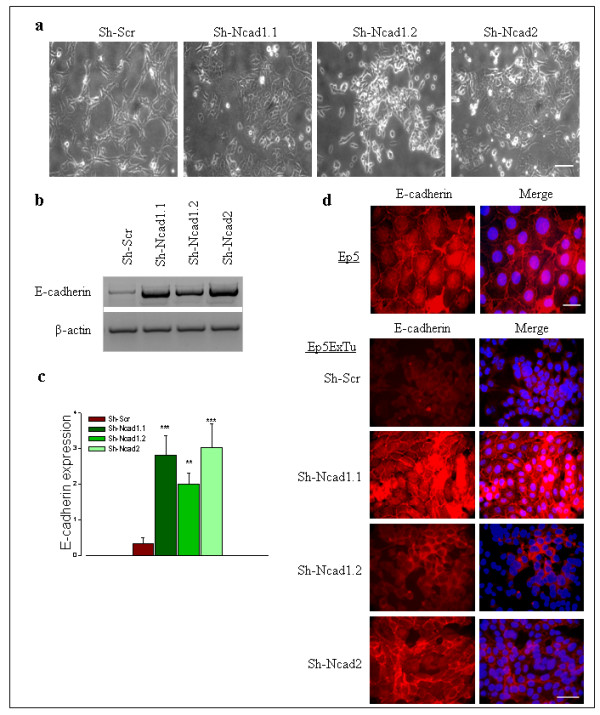
Figure 3.

Neural (N)-cadherin silencing in Ep5ExTu cells induced epithelial (E)-cadherin expression and influenced its localization in the cells in a dose-dependent manner. (a) Phase contrast microscopy of control cell lines (Sh-Scr) and Sh-N-cadherin cell lines (Sh-N-cad1.1, Sh-N-cad1.2 and Sh-N-cad2). Bar, 100 μm. (b) E-cadherin mRNA levels in Ep5ExTu clones. (c) The graph represents the quantification of the relative amount of E-cadherin mRNA in three independent experiments. β-actin was used as loading control. The mean ± SD is indicated. (n = 3) (**, P < 0.0012 and ***, P < 0.0009). (d) Immunolocalization of E-cadherin in Ep5 (Bar, 30 μm) and Ep5ExTu (Bar, 60 μm) clones by immunofluorescence microscopy. Nuclear staining with DAPI is also shown.
