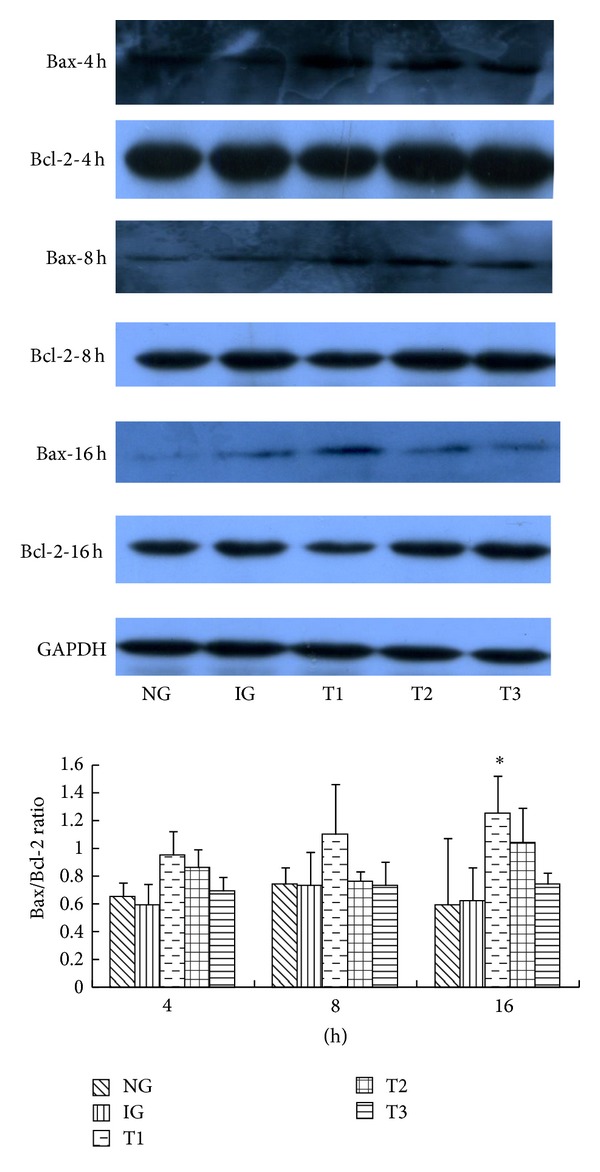
Figure 3.

Western blot analysis of Bax and Bcl-2 in cerulein-treated AR42J cells cultured with or without various concentrations of rhein. Western blot analysis of Bax and Bcl-2 in all groups. Histogram of the Bax/Bcl-2 ratio in all groups. Results are mean ± SE of three independent experiments. *P < 0.05 compared to IG. NG: normal group, IG: inflammation group, T1: treatment group one, T2: treatment group two, and T3: treatment group three.
