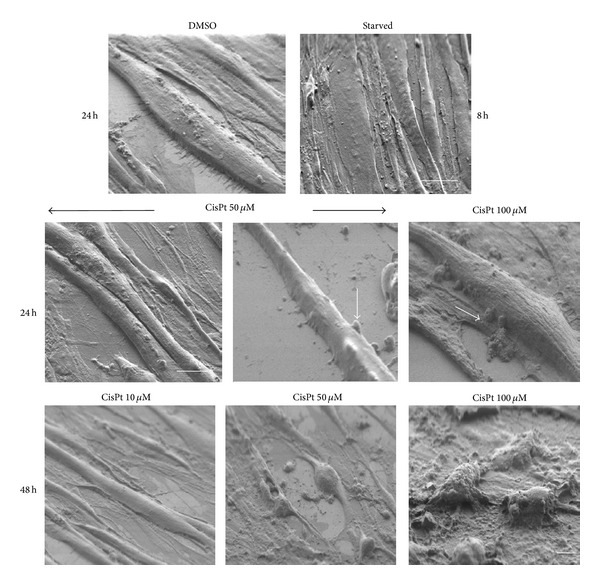
Figure 1.

SEM microphotographs of C2C12 myotubes after DMSO, starvation, or CisPt 10, 50, and 100 μM for 24 or 48 h. Note the blebbings (arrow) after CisPt 50 and 100 μM, already at 24 h, and the almost complete cellular destruction at 48 h of exposure to the highest dose of the drug. DMSO, starved, and 24 h treatment Bar = 10 μm and 48 h treatment Bar = 2 μm.
