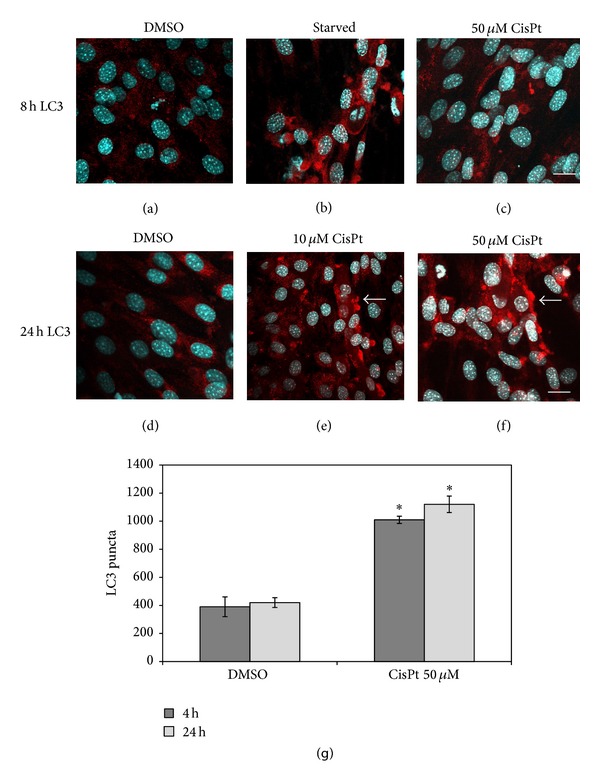
Figure 2.

Dose-dependent LC3 distribution in C2C12 myotubes exposed to CisPt. At 10 μM CisPt red spots were evident at 24 h (e), while at 50 μM earlier both at 8 h (c) and at 24 h (f). For comparison starved cells at 8 h (b) and DMSO-treated cells at 8 h (a) and 24 h (d). Note the peripheral distribution of LC3-positive aggregates after 24 h of treatment with the drug. Bar = 10 μm. At the bottom (g) LC3 quantification demonstrated high increase in CisPt 50 μM at 4 h and 24 h versus DMSO; *P ≤ 0.05 statistically significant.
