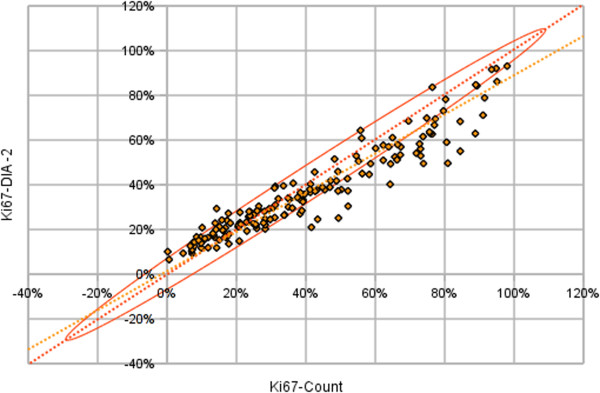
Figure 6.

Orthogonal linear regression analysis. Reference values as explanatory variable and the DIA-2 as dependent variable (yellow) taking into account an ellipse of 95% confidence interval (orange) defined the sampling theory (n = 164 n = 164, P <0.0001, equation of the line: y = 0.877x + 0.012). DIA, digital image analysis.
