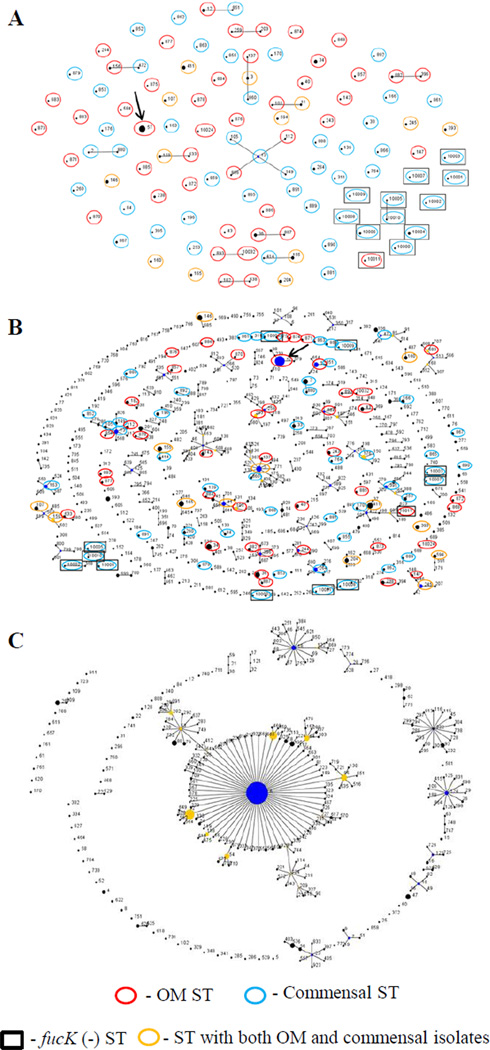
Figure 2.
eBURST analyses of H. influenzae isolates. The most conservative definition of a clonal complex was used, by which STs are included in the group only if they share alleles at a minimum of six of the seven loci with at least one other ST in that group. The size of the circles is proportional to the abundance of the corresponding STs in the data set, and the relative placement of unconnected STs is random. The key at the bottom identifies aspects of the STs identified in this study. The thick black arrows point to ST57. A. Analysis of the 109 STs found in the 170 NTHi isolates of the final dataset. B. Analysis of all 537 NTHi STs found in the MLST database (accessed 03-31-11) and the 12 fucK negative STs from part A. The largest clonal complex consists of 19 STs. C. eBURST analysis of all 281 typeable STs in the MLST database (accessed 06-28-11). The central clonal complex consists of 126 type b STs.

