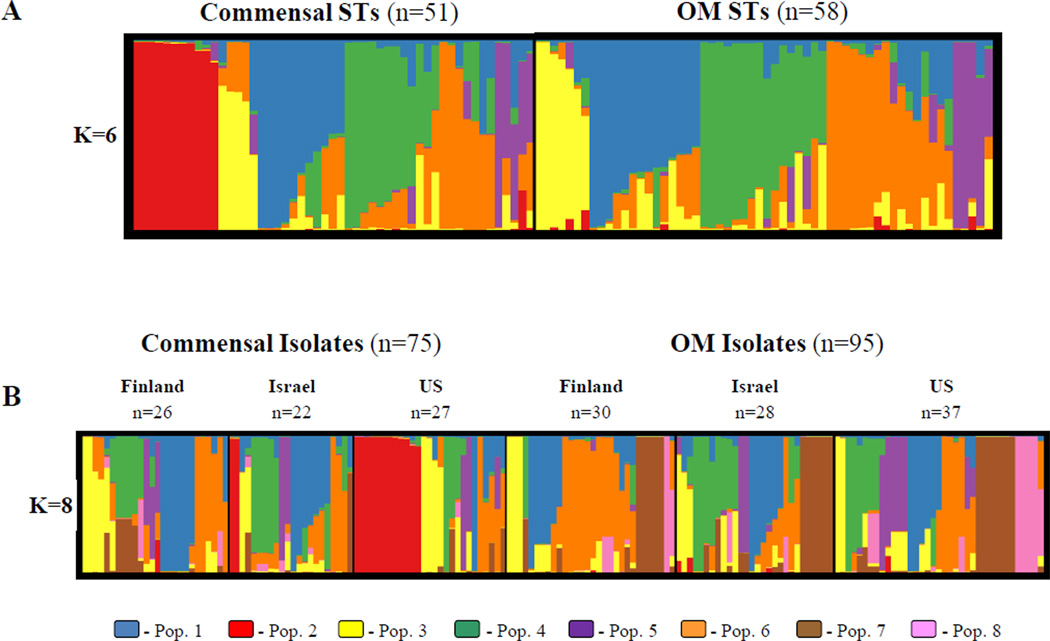
Figure 5.
Inferred population structure from Figures 4A and 4B sorted by individual membership proportion. The number of predefined populations (K) is indicated to the left of each plot. Color coding is consistent with Figure 4. A. Unique STs dataset. B. All isolates dataset.

