Figure 3.

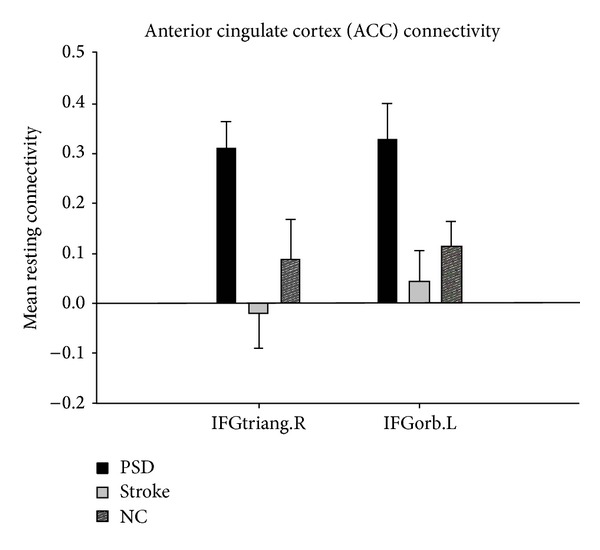
Comparison of PSD, stroke, and NC groups for mean resting connectivity between bilateral ACC and IFGtriang.R and IFGorb.L.

Comparison of PSD, stroke, and NC groups for mean resting connectivity between bilateral ACC and IFGtriang.R and IFGorb.L.