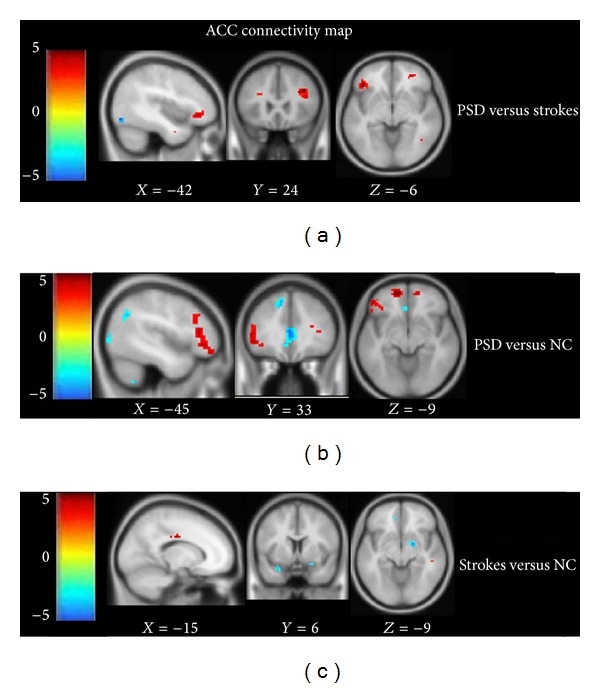
Figure 4.

(a)–(c) Comparison of connectivity maps with ACC between two groups. (a) Intergroup difference between PSD and stroke groups; (b) intergroup difference between PSD and NC groups; (c) intergroup difference between stroke and NC groups. The threshold of the images was at t = 2.42, P < 0.01, corrected by AlphaSim, *P < 0.05.
