
. 2014 May 14;2014:407325. doi: 10.1155/2014/407325
Copyright © 2014 Xiang Zhao et al.
This is an open access article distributed under the Creative Commons Attribution License, which permits unrestricted use, distribution, and reproduction in any medium, provided the original work is properly cited.
Figure 7.
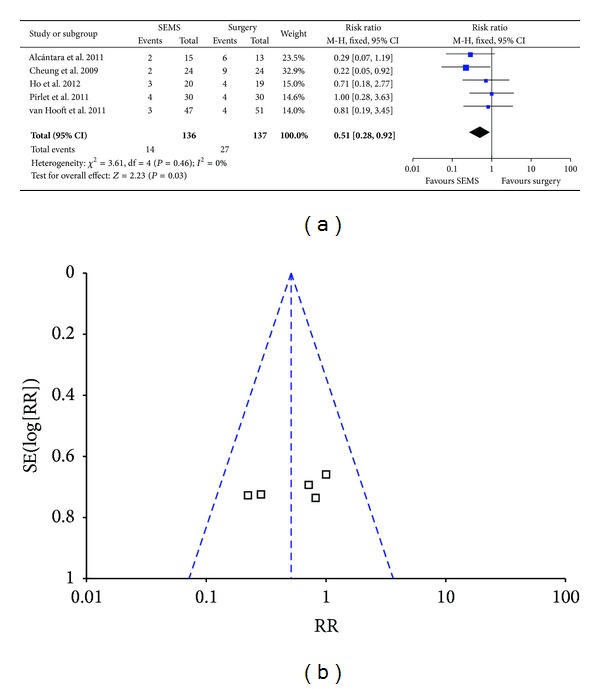
Forest plot and funnel plot of SSI.