Figure 1.

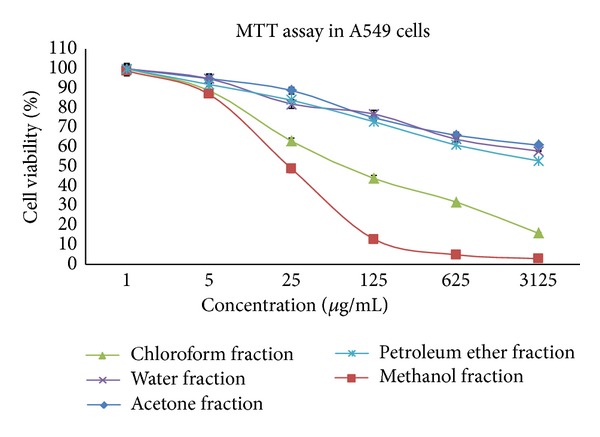
Dose response curve for the effect of the various fractions of S. grandiflora leaves in A549 cells for 24 h. Values are mean ± S.D from six independent experiments.

Dose response curve for the effect of the various fractions of S. grandiflora leaves in A549 cells for 24 h. Values are mean ± S.D from six independent experiments.