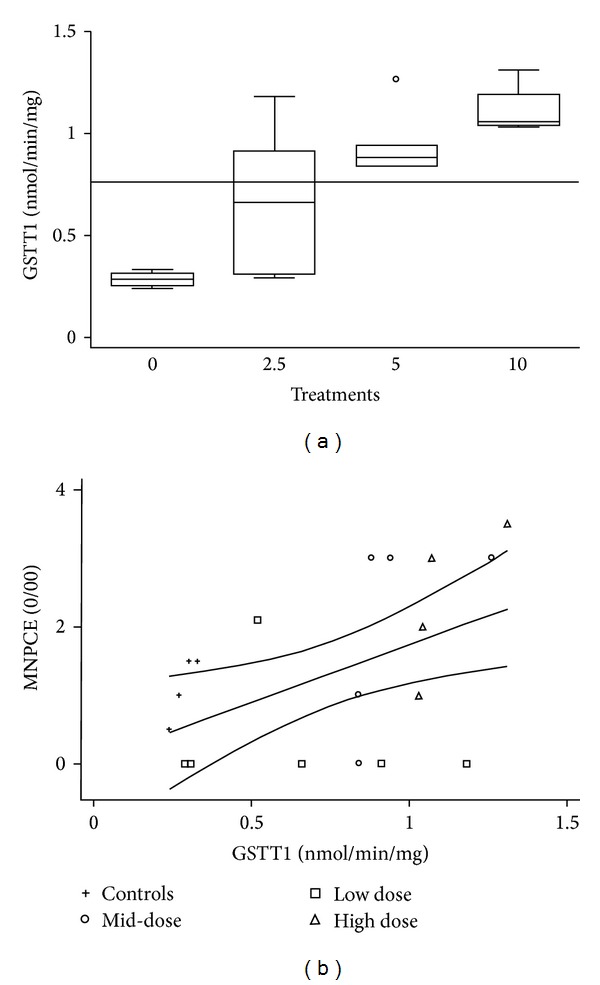
Figure 1.

One-day treatment. (a) GSTT1 metabolic enzyme showed increased activity with the dose. Boxes represent the first and the third quartile and the median value. The line behind the bars represents the overall mean for this enzyme activity. (b) GSTT1 induced activity correlated with MNPCE, R 2 = 0.24, P = 0.037.
