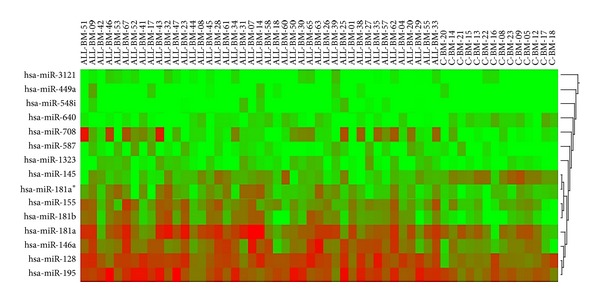
Figure 1.

Heat map and cluster analysis in ALL patients and control cases (FDR P value <0.05). The figure shows the relative expression of bone marrow (ALL-BM) miRNAs in ALL patients and control cases (c-BM). miRNAs are in columns representing the 15 miRNAs, samples in rows representing 43 ALL patients and 14 control cases. The color scale shown on the top illustrates the expression level of the indicated miRNA across all samples: red means that a miRNA expression value is higher than its average expression across all samples (upregulated), and green means a lower expression value (downregulated).
