
Figure 2.
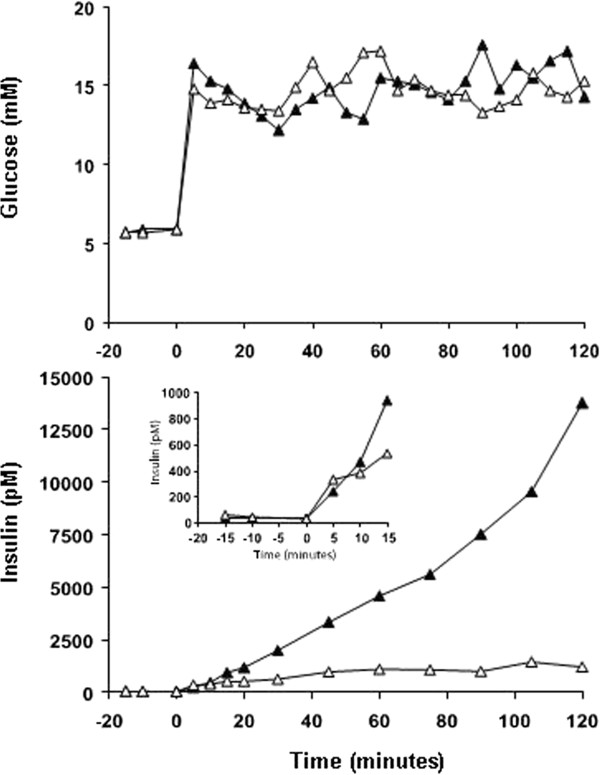
Hyperglycaemic clamps with GLP-1/GIP. Plasma glucose (upper panel) and insulin (lower panel) concentrations in a healthy subject with normal glucose tolerance during hyperglycaemic clamps with continuous infusion of glucagon-like peptide-1 (filled triangles) and glucose-dependent insulinotropic polypeptide (open triangles), respectively. The insert in the lower panel illustrates plasma insulin concentrations during the initial 15 min of the two clamps.