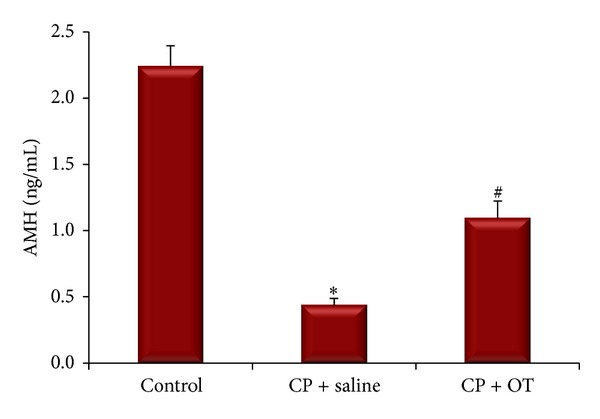
Figure 3.

Alterations in AMH levels of both saline- and OT-treated rats in CP-induced ovarian toxicity. ∗: different from control (P < 0.0005) and #: different from saline group (P < 0.005). Data were expressed as mean ± standard error of mean (SEM).
