Figure 5.

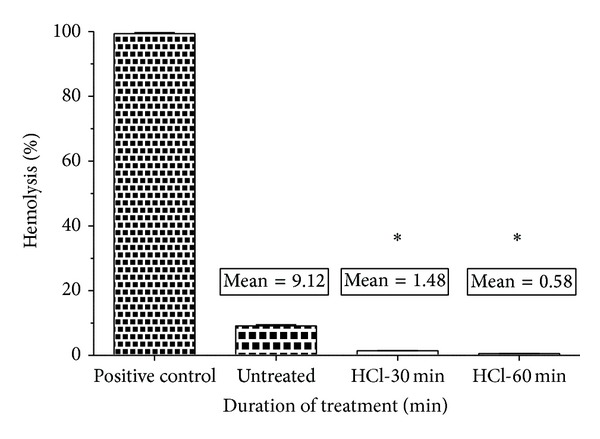
Comparison of percentage of hemolysis of untreated and HCl-treated metallocene polyethylene (n = 3). Values shown are mean ± SD and ∗ indicates differences in the mean are significant (P < 0.05).

Comparison of percentage of hemolysis of untreated and HCl-treated metallocene polyethylene (n = 3). Values shown are mean ± SD and ∗ indicates differences in the mean are significant (P < 0.05).