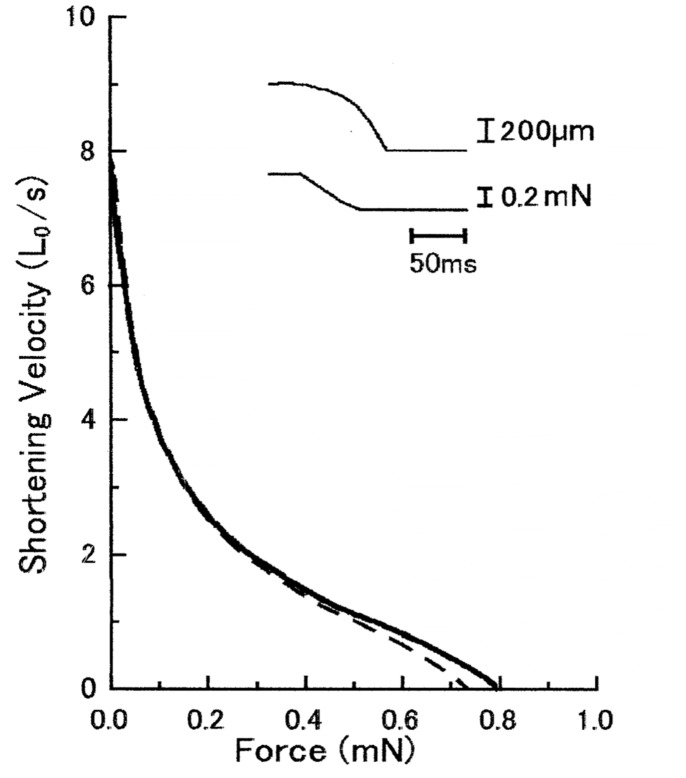
Figure 3. No appreciable effect of anti-CAD antibody on force-velocity curves of Ca2+-activated muscle fiber.
In this and Fig. 5, solid and broken lines indicate force-velocity curves before and after application of anti-CAD antibody (2 mg/ml), respectively. Inset shows an example of fiber length (upper trace) and force (lower trace) changes in response to a ramp decrease in force.

