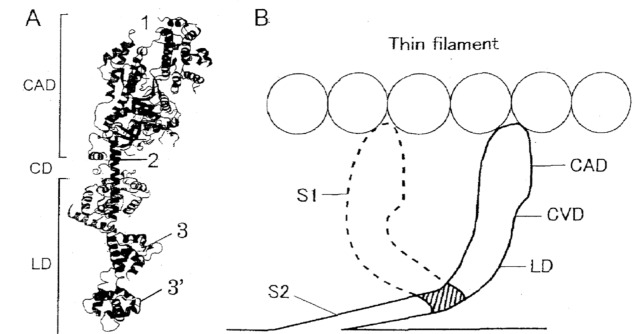
Figure 10. Schematic diagrams showing change in myosin head configuration before and after power stroke.
(A) Ribbon diagram of the myosin head showing approximate regions of attachment of anti-CAD, anti-CVD and anti-LD antibodies, indicated by numbers 1, 2 and 3 and 3′, respectively. (B) Myosin head configurations before and after power stroke, indicated by solid and broken lines, respectively. Note rotation of the LD around the LD-S2 junction (shaded area) as well as rotation of the CAD around the CVD.

