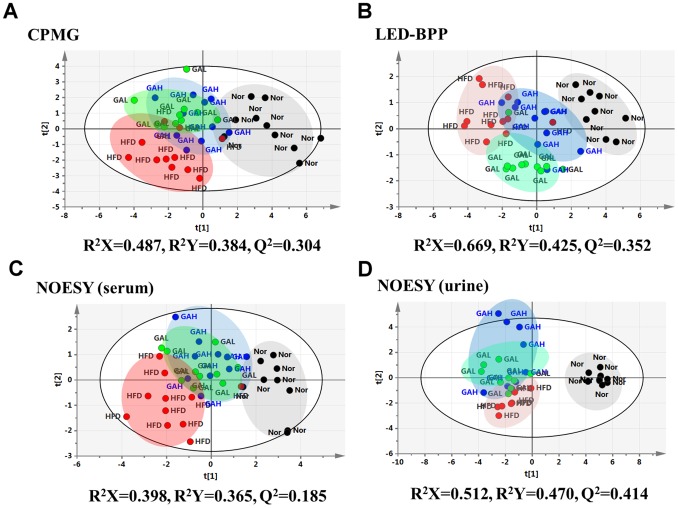
Figure 6. PLS-DA scores plots for (A) standard 1D CPMG spectra of serum, (B) NOESY spectra of serum, (C) BPP-LED spectra of serum, and (D) NOESY spectra of urine from normal group, high fat diet group, and GA treatment group.
Nor, normal group; HFD, high fat diet group; GAH and GAL, high and low dose of GA treatment group.

