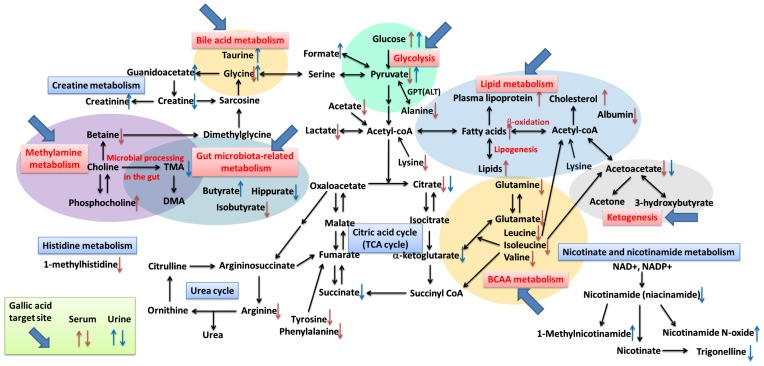
Figure 7. Disturbed metabolic pathways in high-fat diet-induced hepatosteatosis mice.
The metabolic pathways where it was that gallic acid treatment was able to intervene are indicated by blue arrows. ↑, Up-regulated; ↓, down-regulated; red color, serum; blue color, urine. BCAA, Branched-chain amino acids; TCA cycle: tricarboxylic acid-cycle; TMA: Trimethylamine; DMA: Dimethylamine.

