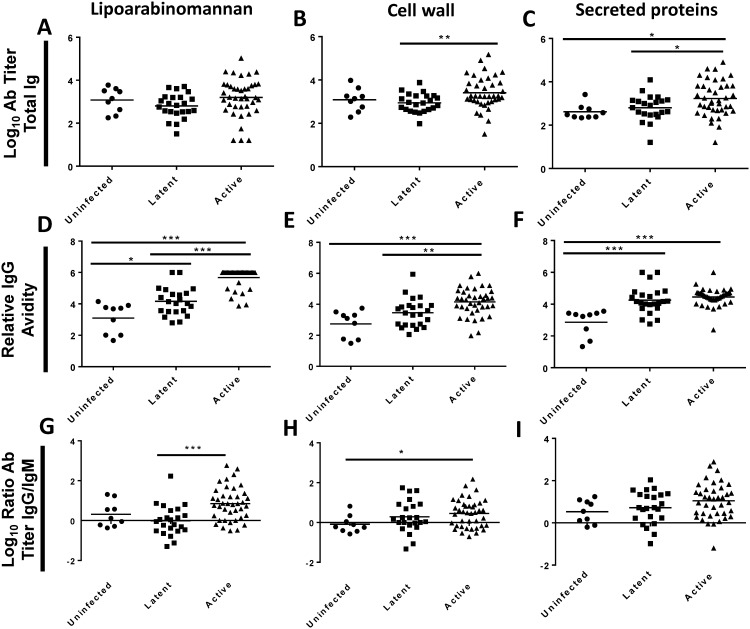
Figure 2. Antibody (Ab) responses to M. tuberculosis to lipoarabinomannan, cell wall, and secreted protein fractions.
Plasma from PPD-negative volunteers (Uninfected), patients with latent TB infection (Latent), or patients with active TB disease (Active) were assayed by ELISA against the surface of live M. tuberculosis H37Rv or H37Rv whole cell lysate. (A–C) Log10 total Ig titers. (D–F) Relative IgG avidity. (G–I) Log10 ratio of IgG to IgM titers. Two-sided p-values by student’s t-test or Mann-Whitney test: (*) p≤0.05, (**) p≤0.01, (***) p≤0.001.

