
Figure 2. Effects of eritoran on OxPAPC-induced mRNA expression (arbitrary units) of IL-6 (top panel) and IL-8 (middle panel) and on FFA-induced mRNA expression (arbitrary units) of IL-6 (bottom panel).
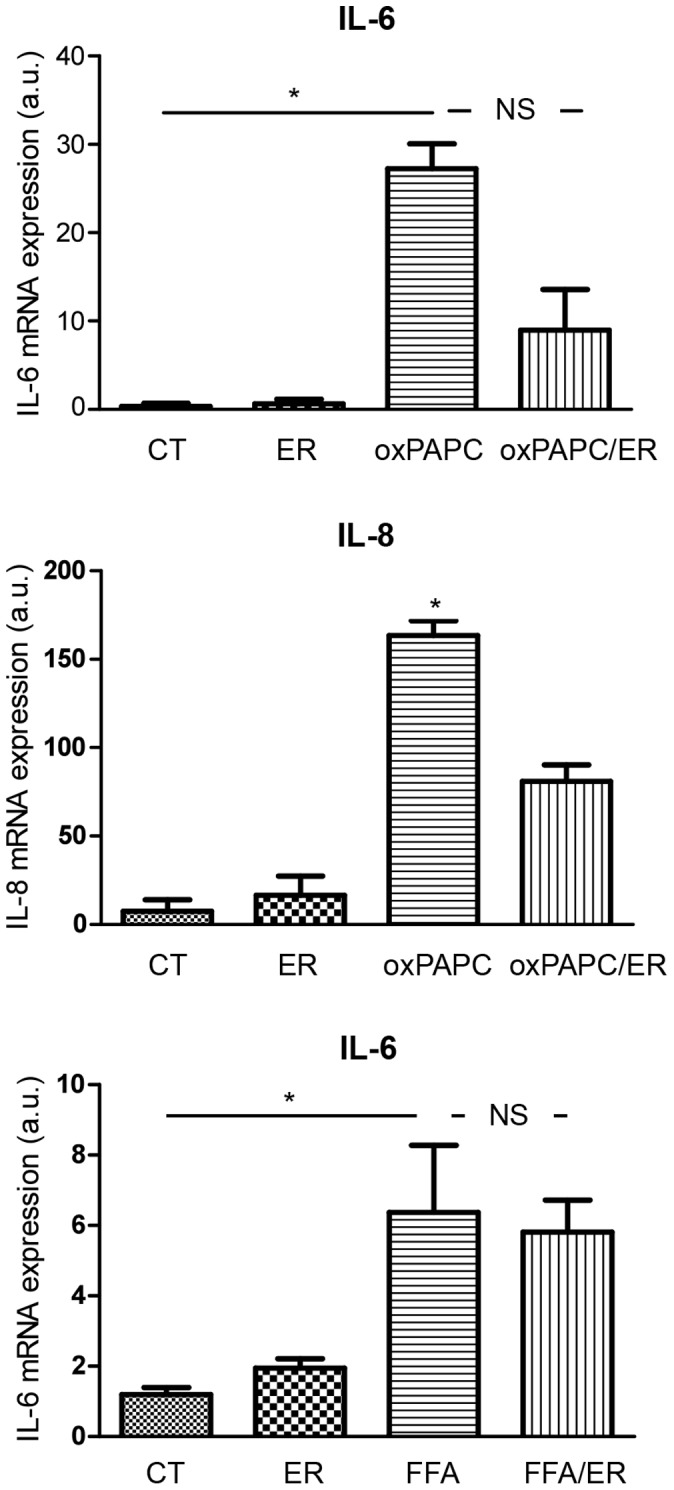
Values reported as mean±SD (n = 5 per group). CT: control; ER: eritoran; OxPAPC: oxidation products of 1-palmitoyl-2-arachidonoyl-sn-glycerol-3-phosphatidylcholine; FFA: free fatty acids; OxPAPC/ER: oxidation products of 1-palmitoyl-2-arachidonoyl-sn-glycerol-3-phosphatidylcholine/eritoran. Top panel: *p<0.05 vs CT and ER; NS: p = 0.07 vs OxPAPC/ER. Middle panel: *p<0.05 vs CT, ER, and OxPAPC/ER. Bottom panel: *p<0.05 vs CT and ER; NS: p>0.05 vs FFA/ER.