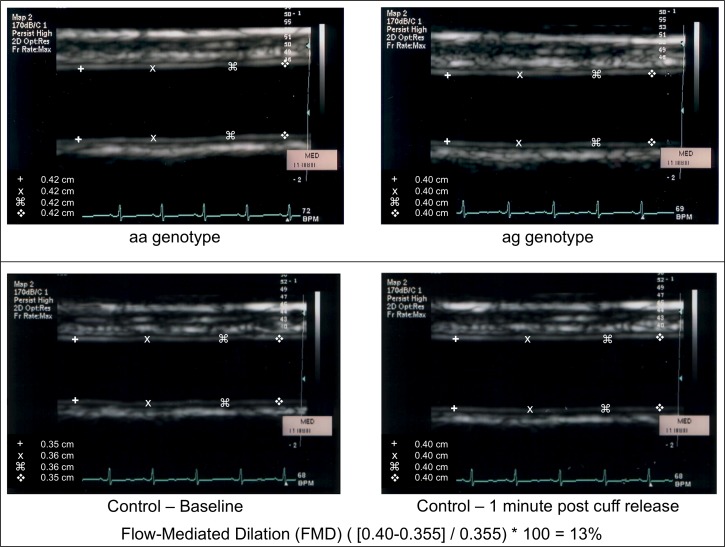
Figure 4. Representative images of the baseline brachial ultrasound of a participant with the aa genotype (top left picture), of a participant with the ag genotype (top right picture), and of the baseline and post-hyperemic ultrasound of a healthy control (bottom pictures).
The calculation of flow-mediated dilation (FMD) using the values collected in the healthy control is also reported.

