
Figure 4. Alginate production at no iron in FRD1 and FRD1043.
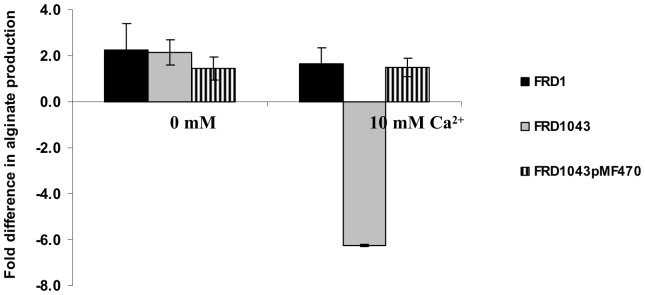
To deprive the cells of iron, seven passages on no-iron BMM (BMM-NI) agar were performed. The cells were collected using saline. The concentration of alginate was determined using sodium alginate (Spectrum) as a standard and normalized by total cellular protein. Fold difference was calculated between the alginate produced after seventh and first passages. The measurements were obtained for at least three biological replicates, and the mean values with standard deviation are presented.