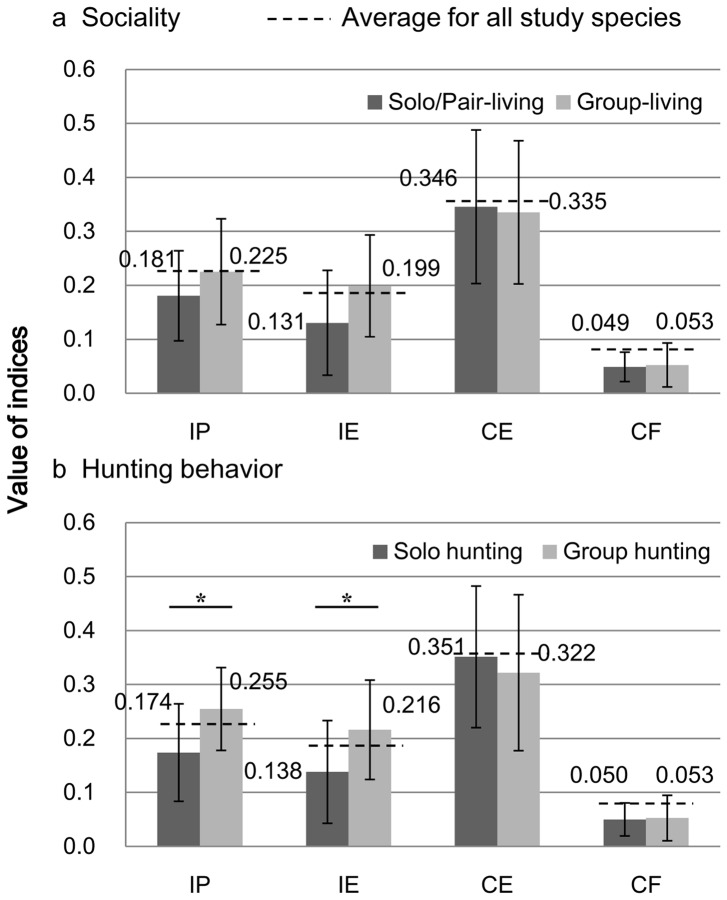
Figure 6. Difference of the four contrast indices on average in sociality and in hunting behavior of the studied canid species.
Vertical bars indicate the standard deviation. Dotted lines indicate the average of the indices among all studied canid species. The four contrast indices did not significantly differ between group-living and solo/pair-living species. The contrast indices reflecting the lightness of iris color (IP and IE) of the group-hunting species were significantly higher than those of solo-hunting species (p = 0.029 for IP and p = 0.043 for IE, *: p<0.05).

