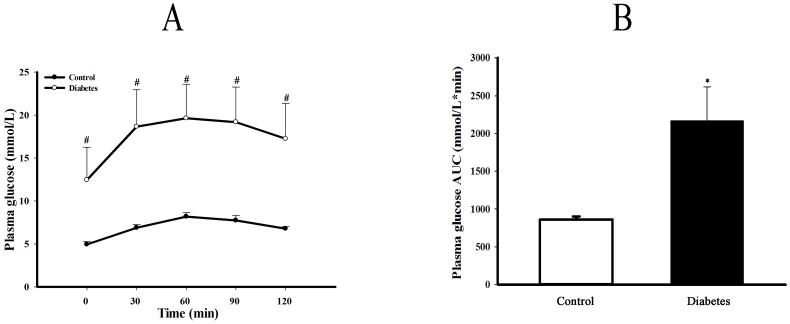
Figure 1. Plasma glucose levels and AUC of OGTT in type 2 diabetic rats.
Panel A shows the plasma glucose levels, and panel B is the area under curve (AUC) of plasma glucose concentration during oral glucose tolerance test (OGTT) of control and type 2 diabetic rats. The AUC was calculated by the formula: AUC(mmol/L*min) = 1/2 ×(BG 0 min+BG 30 min)×30 min +1/2×(BG 30 min+BG 60 min)×30 min +1/2×(BG 60 min+BG 90 min)×30 min +1/2×(BG 90 min+BG 120 min)×30 min. Data are expressed as mean ± SEM, n = 5, *P<0.05 vs Control.

