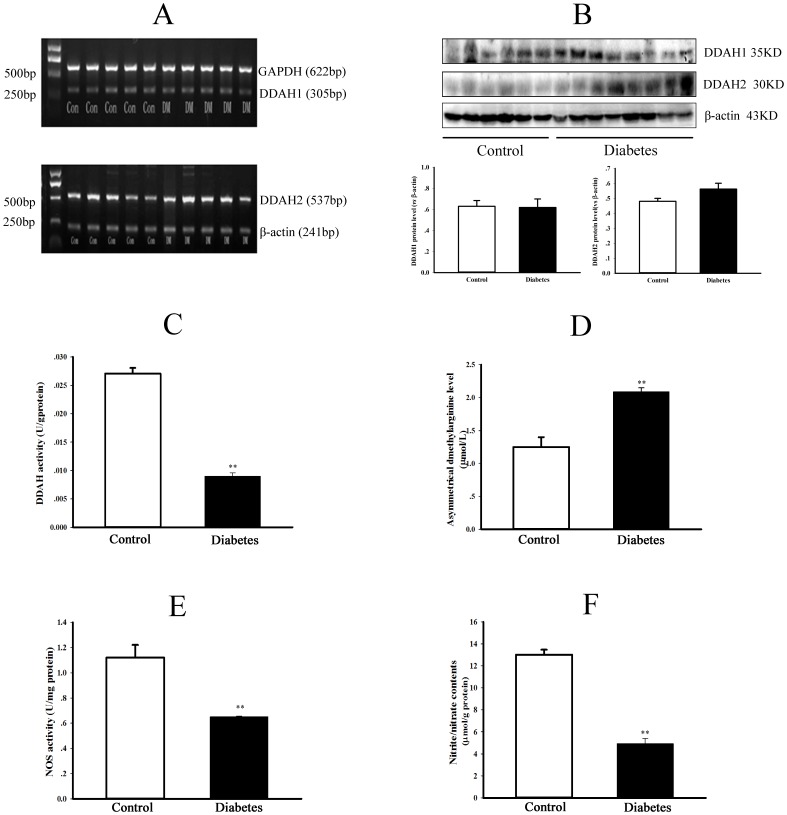
Figure 3. Changes of DDAH/ADMA/NOS/NO pathway in type 2 diabetic rats.
Hepatic DDAH1 & DDAH2 mRNA levels (panel A) were detected by RT-PCR, and protein expressions of DDAH1 & DDAH2 (panel B) were detected by Western blotting. The graphs in panel B represent the quantification of relative DDAH1 or DDAH2 vs β-actin protein levels. In addition, activities of DDAH (panel C) and NOS (panel E), contents of ADMA in serum (panel D) and nitrite/nitrate in the liver (panel F) were measured in control and diabetic rats. Data are expressed as mean ± SEM, n = 5, *P<0.05, **P<0.01 vs Control.

