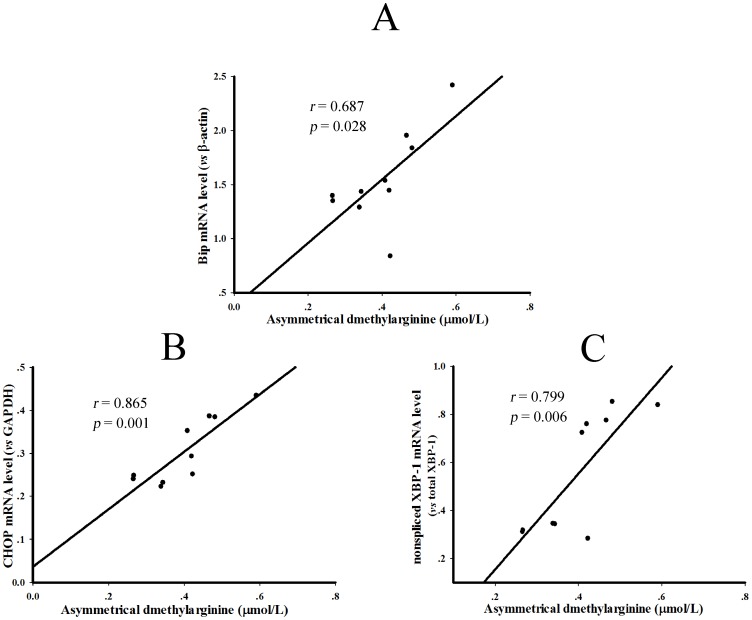
Figure 4. Linear regression analyses between serum ADMA levels and the parameters of hepatic ER stress in the control and diabetic rats.
The linear regression analyses were performed between serum ADMA concentrations and transcription of Bip (A), CHOP (B) and the digestion of XBP-1 PCR products (C) in the liver of control and type 2 diabetic rats. The Pearson correlation coefficients were 0.687 (P = 0.028), 0.865 (P = 0.001) and 0.799 (P = 0.006), respectively.

