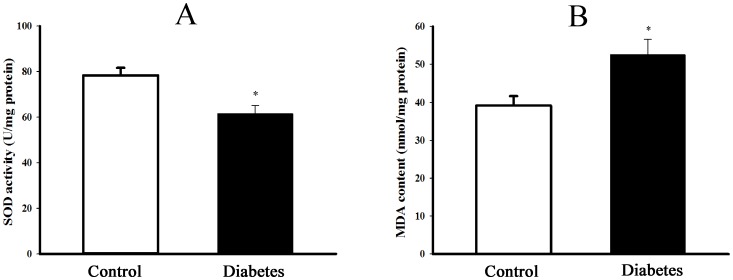
Figure 5. Change of redox state in the liver of type 2 diabetic rats.
The content of lipid peroxidation production malondialdehyde (MDA, panel A) and activity of antioxidant enzyme superoxide dismutase (SOD, panel B) were measured to reflect the redox state in the liver of control and type 2 diabetic rats. Data are expressed as mean±SEM, n = 5, *P<0.05 vs Control.

