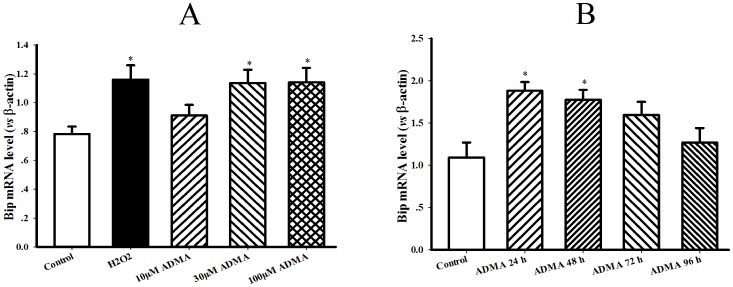
Figure 6. Dose-response and time course of ADMA on Bip mRNA level in hepatocytes.
Rat hepatocytes (H4IIE cell line) were incubated with various dose of asymmetric dimethylarginine (ADMA) for different time as indications. Panel A & B present the gel electrophoresis pictures of Bip PCR products from a representative experiment of ADMA dose-response and time course. Graphs in panel A & B represent the quantification of Bip vs β-actin from 3 independent experiments, respectively. Date are expressed as mean ± SEM, n = 3, *P<0.05, **P<0.01 vs Control.

