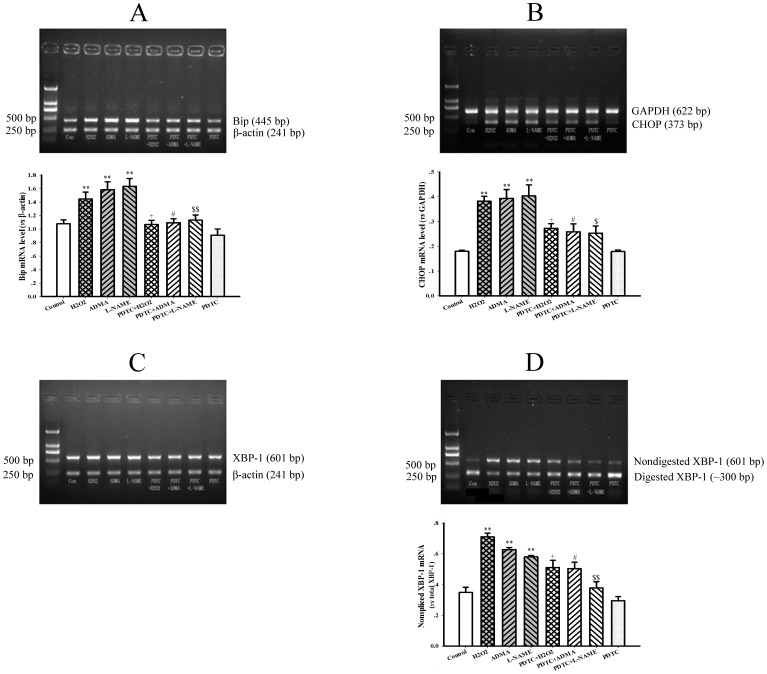
Figure 7. Induction of endoplasmic reticulum stress by ADMA in cultured rat hepatocytes.
Rat hepatocytes (H4IIE cell line) were untreated (Control) or treated with 0.5 mM hydrogen peroxide (H2O2) for 1 h, 30 µM asymmetric dimethylarginine (ADMA), 30 µM NG-Nitro-L-arginine Methyl Ester (L-NAME) and 10 µM Pyrrolidine dithiocarbamate (PDTC) for 48 h, or preincubated with 10 µM PDTC for 2 h and then following the co-incubation with 0.5 mM H2O2 (PDTC+H2O2) for 1 h, 30 µM ADMA (PDTC+ADMA), 30 µM L-NAME (PDTC+L-NAME) for 48 h. Panel A & B show the gel electrophoresis pictures of Bip and CHOP genes PCR products from a representative experiment, and the graphs in A & B represent the quantification of relative Bip and CHOP mRNA level vs internal control gene (β-actin or GAPDH) from 3 independent experiments, respectively. Panel C & D show the gel electrophoresis pictures of XBP-1 PCR products before (total) and after digesting from a representative experiment. The graph in panel D represents the quantification of relative nonspliced XBP-1 mRNA vs total XBP-1 mRNA from 3 independent experiments. Data are expressed as mean ± SME, n = 3. **P<0.01 vs Control; + P<0.05 vs H2O2; # P<0.05 vs ADMA; $ P<0.05, $$ P<0.01 vs L-NAME.

