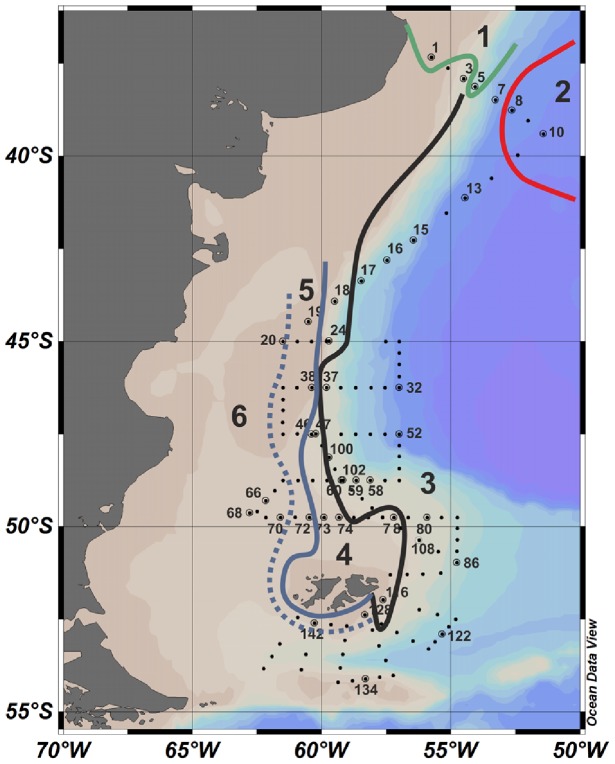
Figure 1. Map of the Patagonian Shelf with sampled stations and distribution of surface water masses.
Distinctions between water masses are indicated by coloured lines. These are drawn after Painter et al. [46] but more specifically for the surface depths rather than the whole depth profile. The black line also signifies the position of the shelf break front. The bathymetry is also indicated in the background. 1 = Rio de la Plata Water; 2 = Brazil Current Water; 3 = Falklands Current Water; 4 = Subantarctic Shelf Water; 5 = High Salinity Shelf Water; and 6 = Low Salinity Shelf Water.

