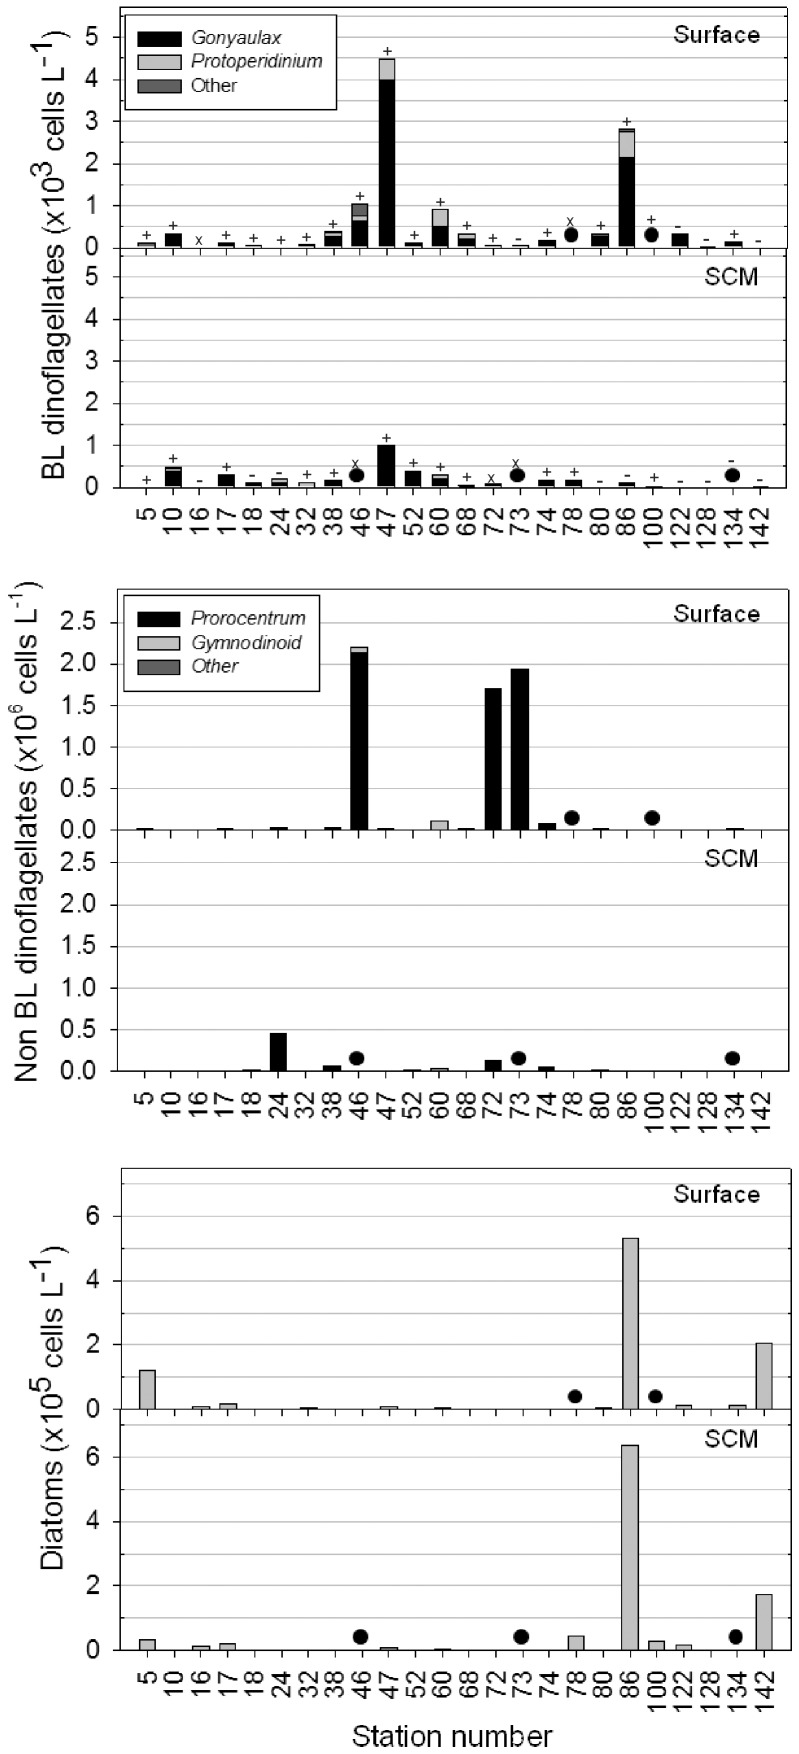
Figure 7. Abundances of key protist groups.
Data are from surface depths (upper panel) and at the depth of the subsurface chlorophyll maximum (SCM; lower panel), at the stations sampled in this study. A black circle indicates no data at that point rather than a zero value. Lcf detection results are superimposed on the plot of bioluminescent dinoflagellates showing positive (+), negative (−), or missing data (x) for each sample.

