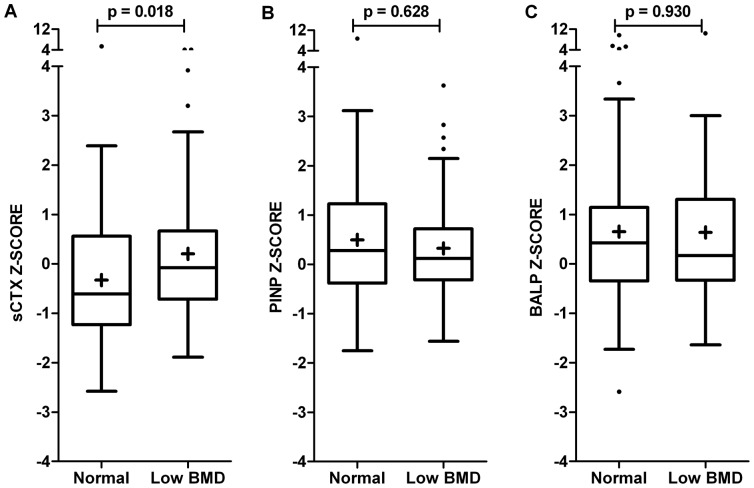
Figure 2. Bone turnover in AS patients with low (n = 66) and normal (n = 85) BMD.
A) bone resorption marker sCTX, B) bone formation marker PINP, C) bone formation marker BALP. Box-and-whisker plots (Tukey): boxes indicate medians with interquartile ranges;+indicate means; whiskers indicate 1.5 times the interquartile distances; · indicate outliers.

