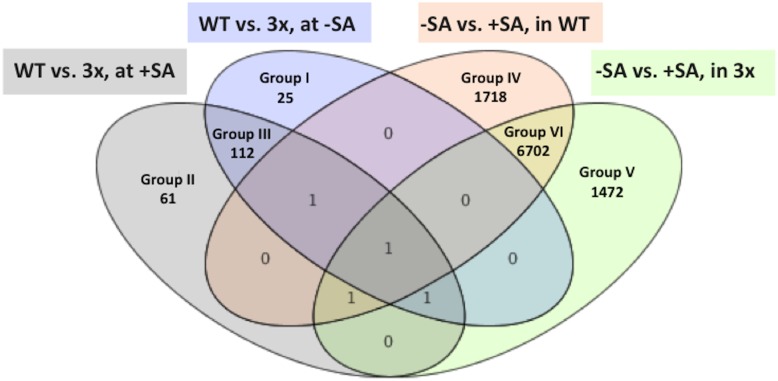
Figure 5. Venn diagram showing overlap of differentially regulated genes identified in microarray analysis.
Four lists of genes that were differentially expressed at least 1.5-fold between the indicated conditions were used to construct the Venn diagram. The genes of groups I–V are listed in Tables S3, S4. Groups I to III contain genes differentially expressed between 3xbhlh and wild type. Groups IV and V contain genes that show differential regulation between + and –SA treatment but not between wild type and mutant.

