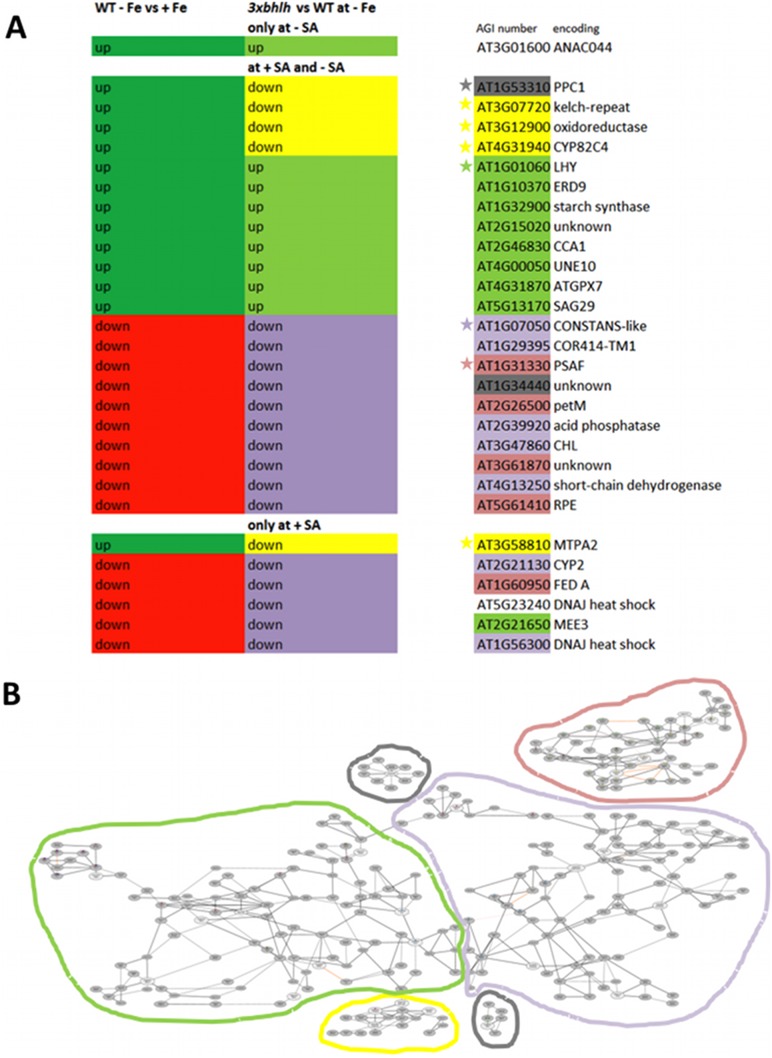
Figure 6. Regulation of the subset of 29 Fe-regulated genes out of groups I, II and III identified in microarray analysis.
The list of Fe-regulated genes in wild type seedlings that we had published earlier [12] was used to compare with the list obtained in this work for the groups I–III. 29 genes of the groups I–III were found Fe-regulated in [12]. A, Regulation patterns, annotation and co-expression of the subset of 29 genes; the regulation at +Fe versus –Fe in the wild type is represented in the left-most column (in dark green up = up-regulated, in red down = down-regulated); the regulation in the 3xbhlh mutant versus WT is shown in the middle column (in light green up = up-regulated and in yellow or violet down = down-regulated; note that the yellow color indicates that these genes do not follow in the 3xbhlh mutant the regulation expected from –Fe versus +Fe in the left column and hence could be direct targets of bHLH39, bHLH100 and bHLH101). The Arabidopsis gene identification (AGI) numbers and annotations are shown on the right side, whereby the color code indicates the belonging to different co-expression networks as determined using the ATTED tool (ref), represented in B; B, Co-expression network analysis of the 29 genes; the ATTED tool was utilized for construction; the different networks are highlighted in color and the AGI numbers belonging to those networks are highlighted by the same color in A. The grey color indicates genes that are part of isolated co-expression networks. A high-resolution image of the co-expression networks is shown in Fig. S3.

