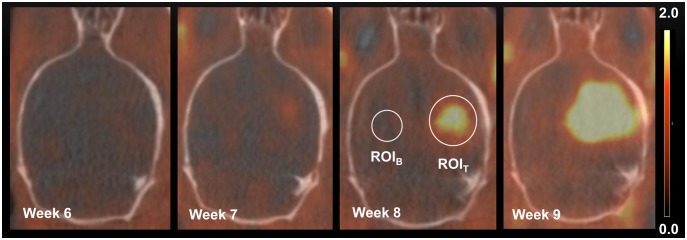
Figure 2. Fused 18F-FET PET/CT images.

Fused 18F-FET MicroPET/CT images showing tumor progression 6–9 weeks after tumor cell injection. Transverse views through the brain of the same mouse. Illustrated in the figure is a ROIT drawn round the region with maximum tracer uptake and a 4 mm3 ROIB drawn in the contralateral hemisphere. Scale bar: 0.0–2.0 SUVmax.
