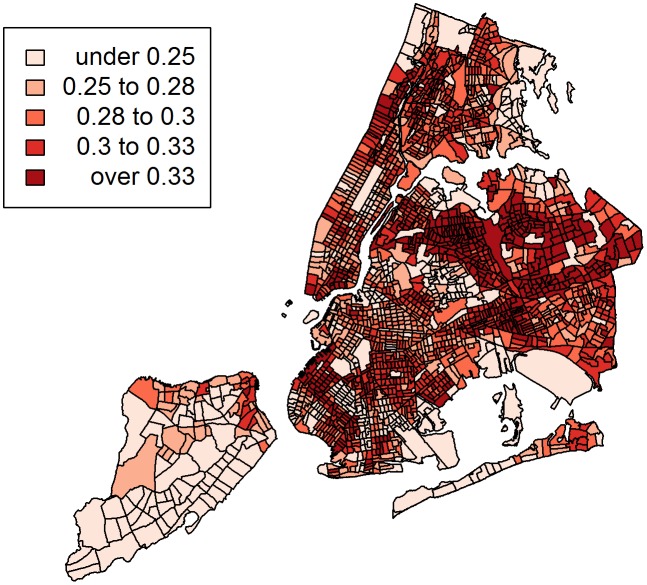
Figure 1. Predicted probabilities of toxocariasis by New York City census tracts.
Quartiles of toxocariasis probability were used as the cutpoints for the choropleth categories. The infection probability for each tract was estimated by taking a weighted average of the predicted probabilities for each subpopulation in the logistic regression model, weighted by the proportion of that subpopulation's presence in a given census tract.

