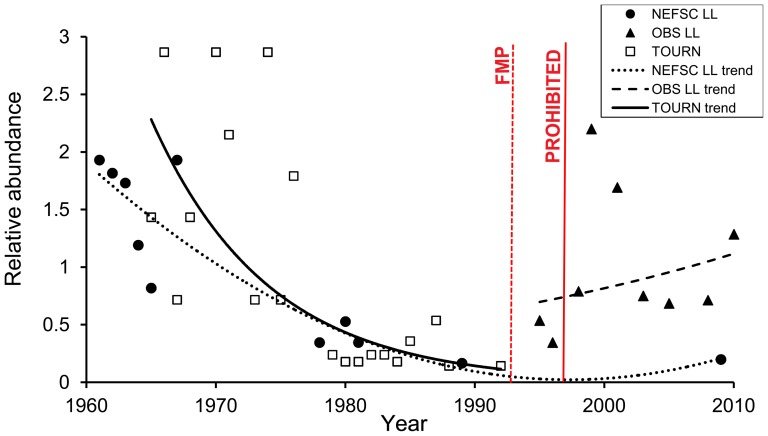
Figure 6. White shark relative abundance.
White shark indices of abundance (index/mean) standardized using a zero-inflated Poisson model plotted by year for three time series: NEFSC LL = Northeast Fisheries Science Center fishery-independent longline surveys, TOURN = NEFSC tournament database, and OBS LL = observer program of the directed shark longline fishery. Trend lines are best fit regression models of the standardized data (second order polynomial for NEFSC LL and exponential for TOURN and OBS), using R2 values and considering the biology of the white shark. The dashed red line indicates the year of the first fishery management plan (FMP) for Atlantic sharks in 1993 [77] and the solid red line indicates the year that white sharks were listed as a NMFS prohibited species in 1997 [21].

