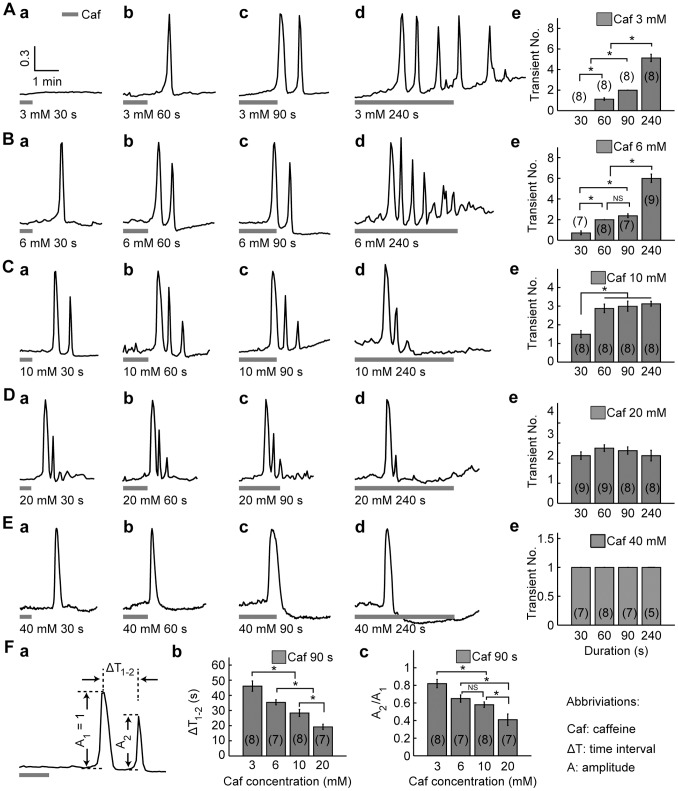
Figure 1. Caffeine induced [Ca2+]i increase in a duration- and concentration-dependent manner.
A–E, [Ca2+]i transients induced by the application of 3, 6, 10, 20, and 40 mM caffeine, respectively. Columns (a)-(d), [Ca2+]i transients induced by the application of caffeine for 30, 60, 90, and 240 s, respectively. Column (e), The average number of [Ca2+]i transients (transient NO.) induced by various durations of caffeine application under each concentration. F, Dependence of caffeine-induced [Ca2+]i responses (with identical application time of 90 s) on caffeine concentration. (a), Definition of amplitude and time interval between the first and the second Ca2+ peaks (ΔT1–2). The amplitude of the second [Ca2+]i transient (A2) is normalized against that of the first one (A1). (b), ΔT1–2 decreased with caffeine concentration. (c), A2/A1 decreased with caffeine concentration. Horizontal bars bellow the traces indicate the periods of caffeine applications. With our perfusion rate being 1 ml/min, 1 min was needed for the drug to reach the perfusion chamber. In this and subsequent figures, each trace is the representative of a group of independent experiments, and data are presented as mean ± SEM (with sample size in parentheses). * denotes statistical significance of p<0.05 by one-way ANOVA followed by post hoc SNK test, NS: not significant.

