
Figure 2.
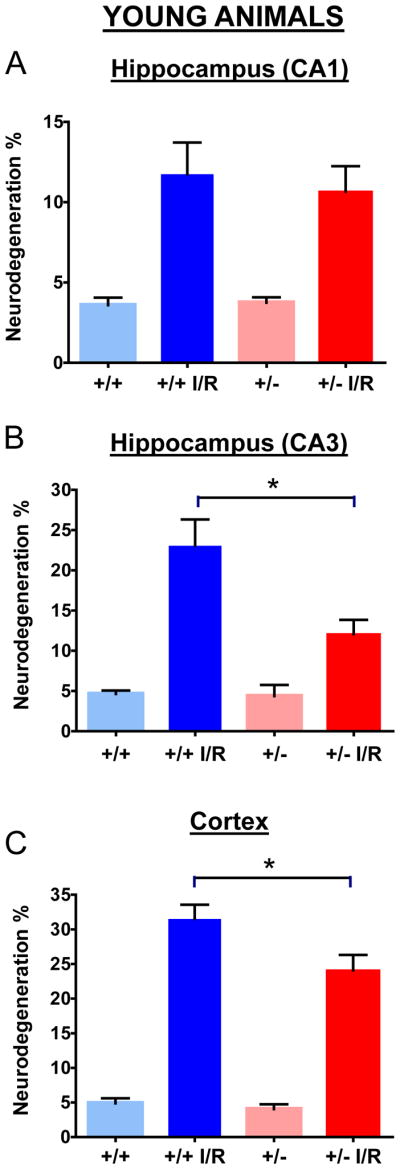
Quantification of neurodegeneration in hippocampus and cerebral cortex of young Mclk1+/+ and Mclk1+/− mice. Neurological damage was determined in CA1 (A), CA3 (B) as well as in the cortex region (C) of control (sham operated) and ischemia-reperfused (I/R) animals of both groups. Data are means ± SEM of 11–20 animals. * denotes statistical significance of the differences between Mclk1+/+ and Mclk1+/− animals following BCCAO, P < 0.05.