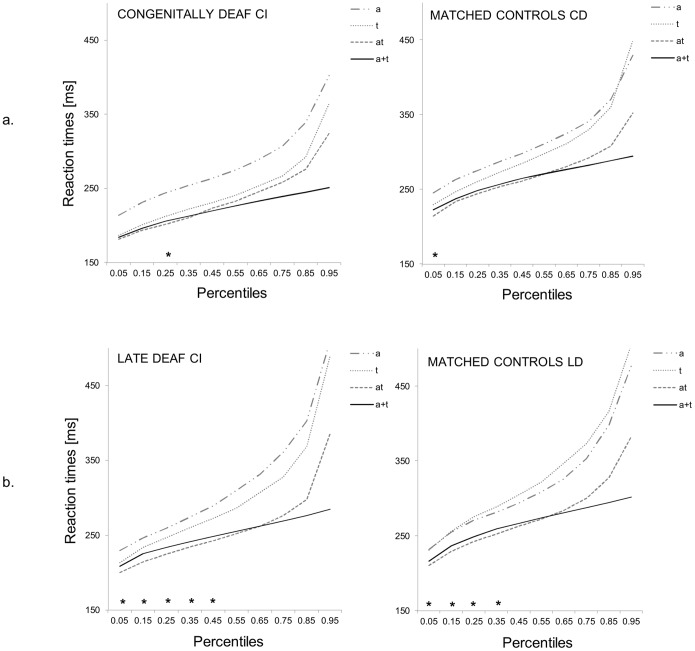
Figure 5. Multisensory facilitation indexed by violation of the race model.
Cumulative distribution functions for response time to unisensory auditory and tactile stimuli and crossmodal stimuli for a. congenital deaf CI recipients and their age-matched controls and b. late deaf CI recipients and their age-matched controls. The filled black line indicates the summed proportions to unimodal stimuli (a+t, race model), at the violation of the race model, and a and t the responses to single auditory and tactile stimuli, respectively.

