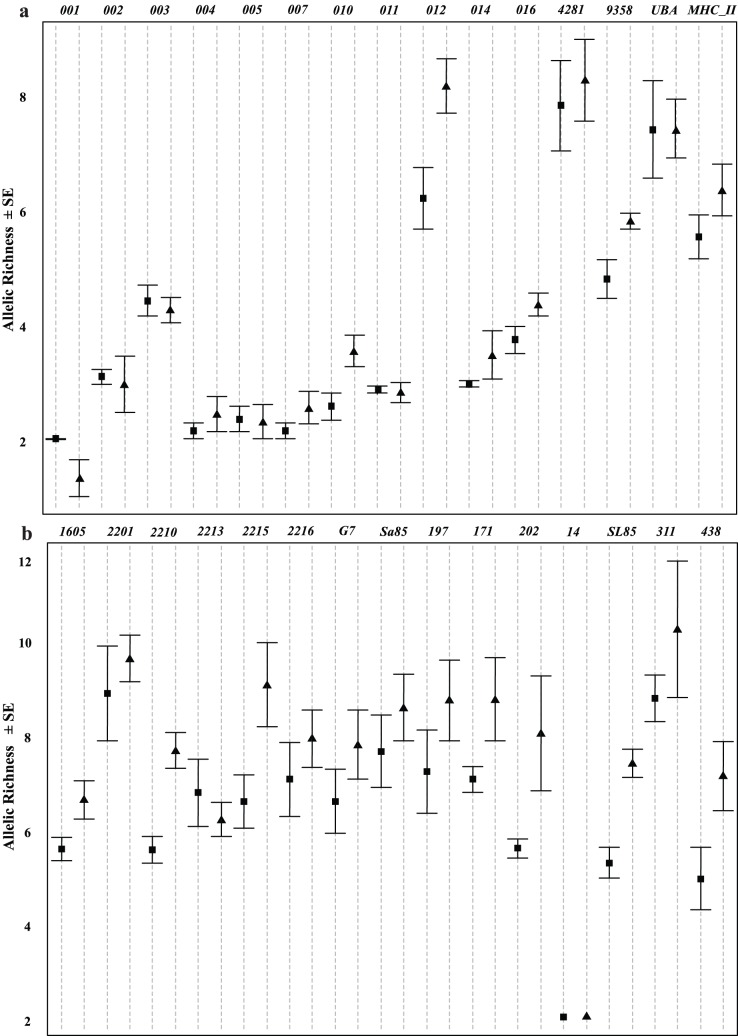
Figure 1. Comparisons of mean allelic richness ± standard error for neutral loci (a) and immune loci (b) for samples taken during the epizootic (square) and sample taken during recovery (triangle).
Locus names (see Table 1) are abbreviated. Figure created using R v.2.1.3.1 [57], using dotplots.errors [58].

