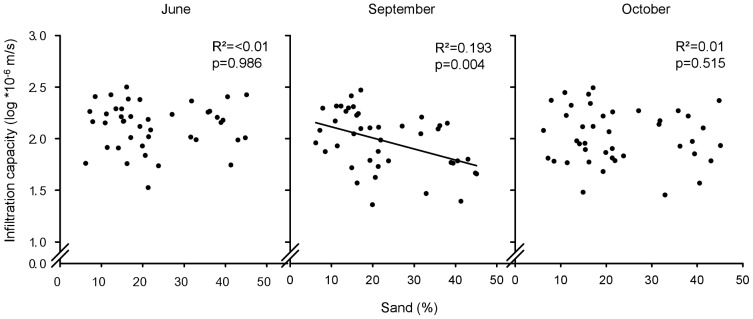
Figure 1. Relationship between infiltration capacity and soil texture for June, September, and October.

Plot-level infiltration capacity at saturation plotted against soil texture (sand fraction in 0–10 cm depth in %) for the month June, September and October (as indicated). The regression line indicates significant relationships.
