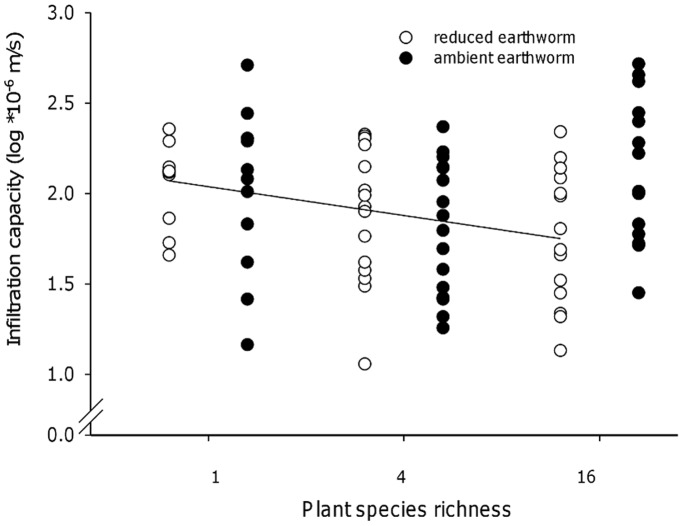
Figure 2. Interacting effects of plant diversity and earthworms on the infiltration capacity in October.
Effect of plant species richness (1, 4, 16 species) and earthworm treatment (ambient earthworm density subplots and reduced earthworm density subplots) on the infiltration capacity at saturation. The regression line indicates a negative correlation between plant species richness and infiltration capacity on subplots with reduced earthworm densities (r = 0.33, p = 0.036).

