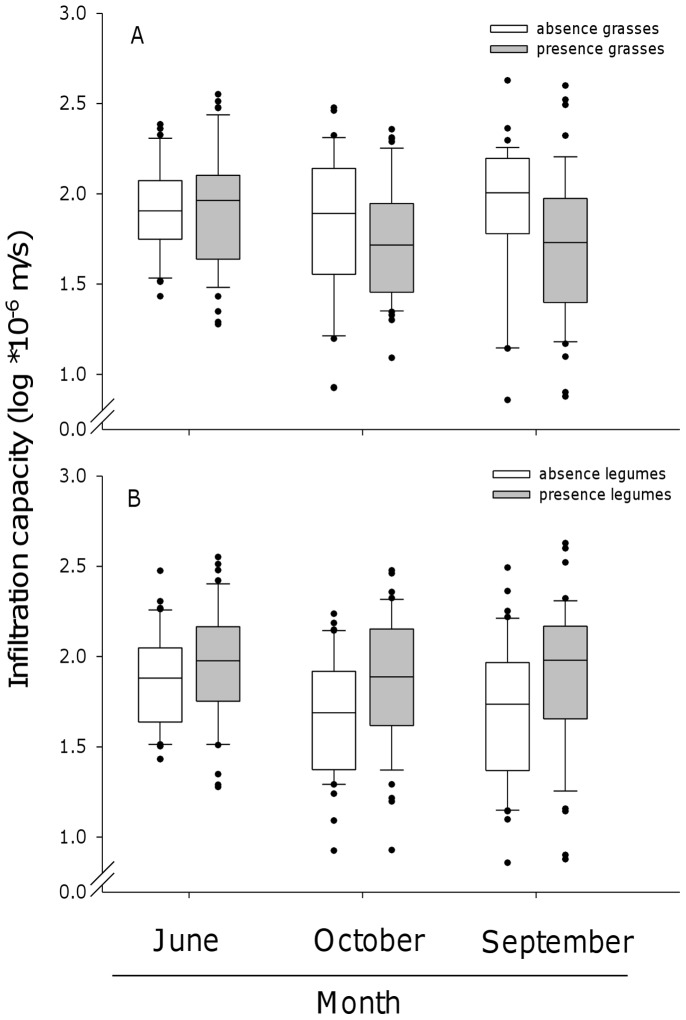
Figure 3. Effects of certain plant functional groups (presences of legumes and grasses) on the infiltration capacity.
Variations in infiltration rates in June, September, and October as affected by (A) the presence of grasses, and (B) the presence of legumes at saturation. The box plots represent the median, the ends of the boxes defined the 25 and 75 quartiles. The error bars show the 10th and 90th percentiles of the data. Black dots outside of the 10th and 90th percentiles represent outliers.

