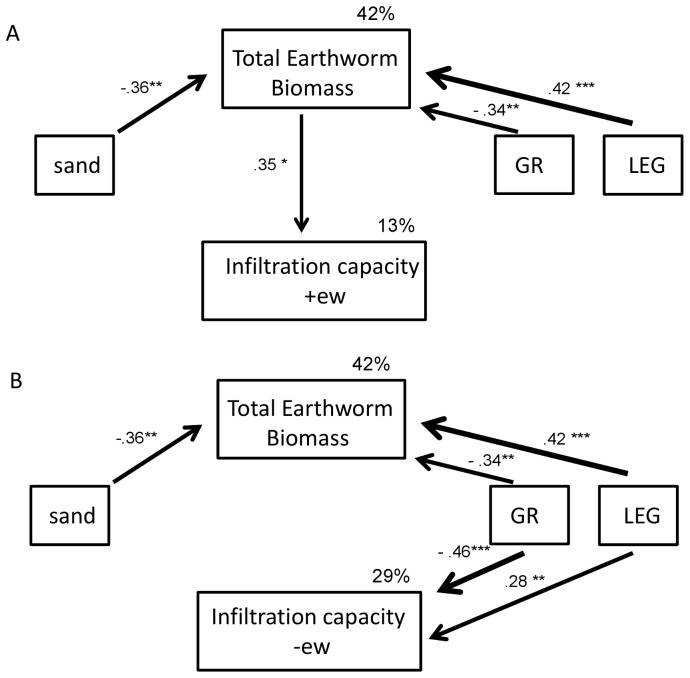
Figure 5. Path analysis of factors explaining infiltration capacity on plots with ambient or reduced earthworm density.
Relationships between total biomass of earthworms (earthworm biomass), texture (sand in 10 cm depth) and plant functional groups (GR, grasses; LEG, legumes) for (A) infiltration rate on subplots with ambient (infiltration capacity +ew) and (B) reduced earthworm densities (infiltration capacity –ew) in October. The total earthworm biomass was extracted in September. Standardized path coefficients are given next to path arrows. Unexplained variation is denoted with e1–e3; *p≤0.05, **<0.01, ***p = 0.001. For details see text.

