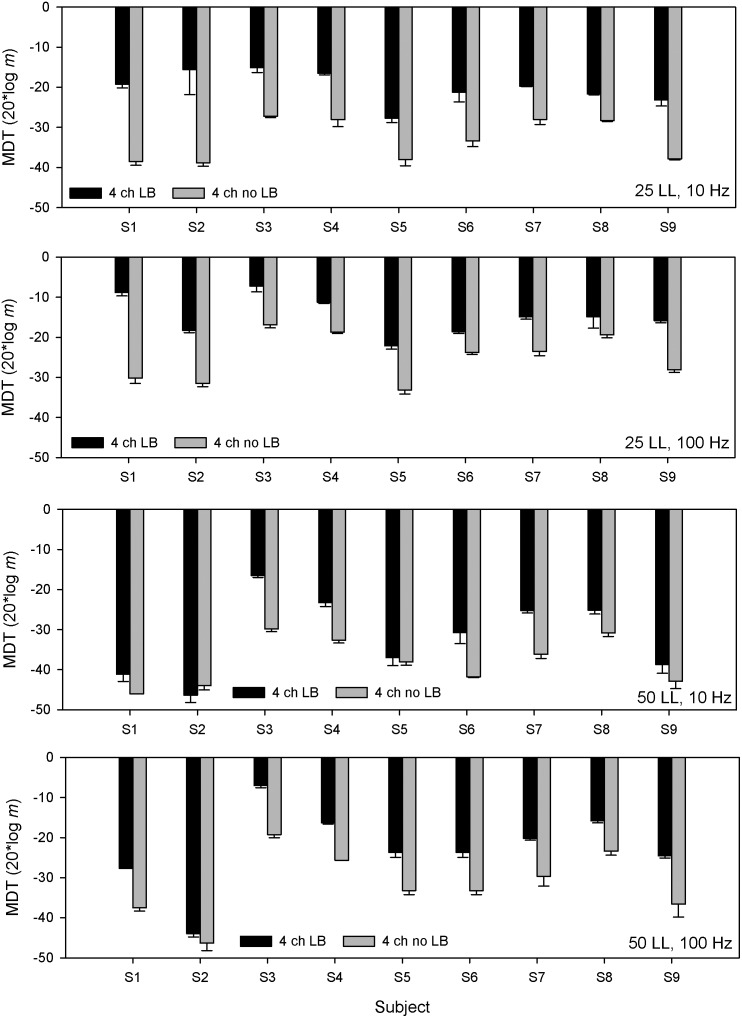
Figure 3. Multichannel MDTs for individual CI subjects.
From top to bottom, the panels show 10-Hz MDTs at 25 LL, 100-Hz MDTs at 25 LL, 10-Hz MDTs at 50 LL, 100-Hz MDTs at 50 LL, respectively. The black bars show the MDTs for the 4-channel loudness-balanced stimuli (i.e., equally loud as the single-channel stimuli in Fig. 1) and the gray bars show MDTs for the 4-channel stimuli without loudness-balancing (i.e., louder than the single-channel stimuli in Fig. 1 and the 4-channel loudness-balanced stimuli). The error bars show the standard error.

