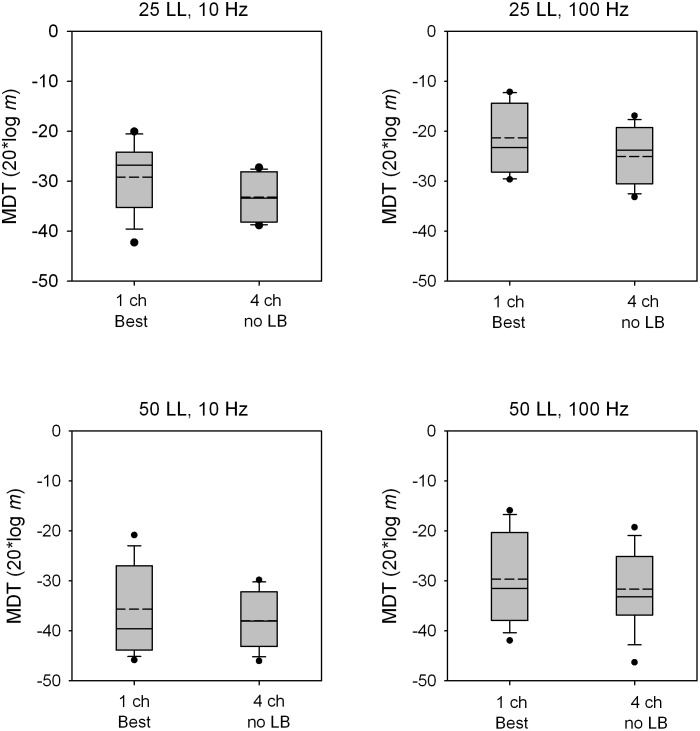
Figure 5. MDTs for single- and multi-channel stimuli without loudness summation compensation.
Box plots are shown for MDTs with the best single-channel or with the 4-channel stimuli without loudness-balancing; note that the 4-channel stimuli without loudness-balancing were louder than the single-channel stimuli. From left to right, the panels show data for the 25 LL/10 Hz, 25 LL/100 Hz, 50 LL/10 Hz, 50 LL/100 Hz conditions. In each box, the solid line shows the median, the dashed line shows the mean, the error bars show the 10th and 90th percentiles, and the black circles show outliers.

