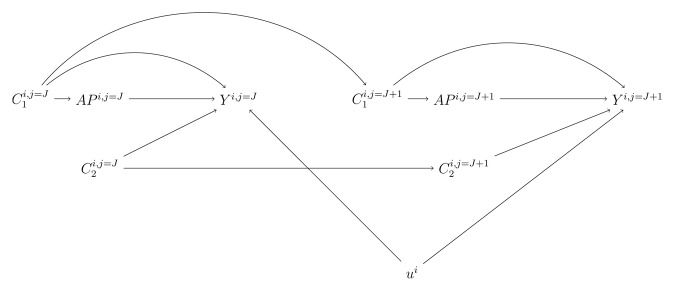
Figure 2. Directed acyclic graph (DAG) at visits j = J and j = J+1. We present the directed acyclic graph (DAG) at adjacent visits j = J and j = J+1 to illustrate the relationships we assumed between the variables included in the regression models. APi,j represents 1st, 2nd, 3rd, and 4th weeks averages of air pollutant concentration before the jth visit of the ith participant. Yi,j represents the ith participant gene-specific DNA methylation at visit j. C1i,j and C2i,j corresponds to the potential confounding variables and risk factors of DNA methylation for participant ith at visit j, respectively. ui represents the random intercept of participant i.
